How to find your product adoption indicator: a step-by-step guide to finding the number that makes your users stick

Every startup needs to know what makes a user stick. Figuring this out helped us make key decisions to grow our business. We’ve all heard about Facebook's "7 friends in 10 days" story. But how do you go about finding what makes your product stick?
We’ve got a great system at Jam that we learned from Product Led Onboarding by Ramli John and Wes Bush. You should definitely check out this book if you want to learn about growth and specifically, product-led growth. Read on to see how you can find this number for your product too!
Enter product adoption indicator
Many people also call this the magic number. The gist of the idea is: what (and how many) core actions are your retained users taking inside your product that indicate that they will build a habit and continue to use your product?
We were on a quest to find that number for Jam and trying to answer the following question: “If a Jam user creates X jams within Y days of signing up, they are more likely to stick around in the long run”. In the following steps I am going to show you how you can find your product’s magic number:
Prerequisites
Before you get started, complete your cohort analysis. For our made-up workflow product that we will use as an example, we will pick 8-week retention as a frame of reference. Note that you can pick whatever retention makes sense for your product. So, for you, this could be 6 months retention or 12 months retention or 12 weeks retention, etc. The number you pick does not change the steps to identify your product adoption indicator.
Step 1: Pick one of your core actions:
This is one of the core actions that is directly related to the value your product provides. Note that you are not picking an outcome, you are picking one of the actions a user takes. In plain English: pick an important thing that your user does. Here are some examples of core actions from different products:
Consumer
- Snapchat: users sharing snaps.
- Tinder: users swiping right.
- Instagram: users posting photos.
Mid-market SaaS
- Grain: users creating highlights.
- Tines: users creating stories.
- Notion: users creating posts.
Enterprise SaaS
- Salesforce: users creating reports.
- Snowflake: users creating pipelines to ingest data.
- ServiceNow: users creating workflows.
Note that a product can have multiple core actions but our first step is to pick one core action and analyze if the core action is a good indicator of product adoption. And then repeat for the other core actions in your product. Also, if your product has different types of users for example TikTok has content creators and content consumers, the core actions are different for those users. If you are trying to measure the product adoption indicator for your different users it’s important you look at both types of users with their corresponding core actions. For this post, we will keep it simple and assume you only have one type of user.
For the next steps, I am going to pick a fictional mid-market SaaS product that lets you create automated workflows and pick the following hypothesis: “Number of workflows created during the first week.” What you are trying to identify here is what’s the magic number of workflows a user needs to create during their first week to have a higher chance of adopting the product (and continuing to use it) in the long term.
Step 2: Set the table
Create a table that looks like below:
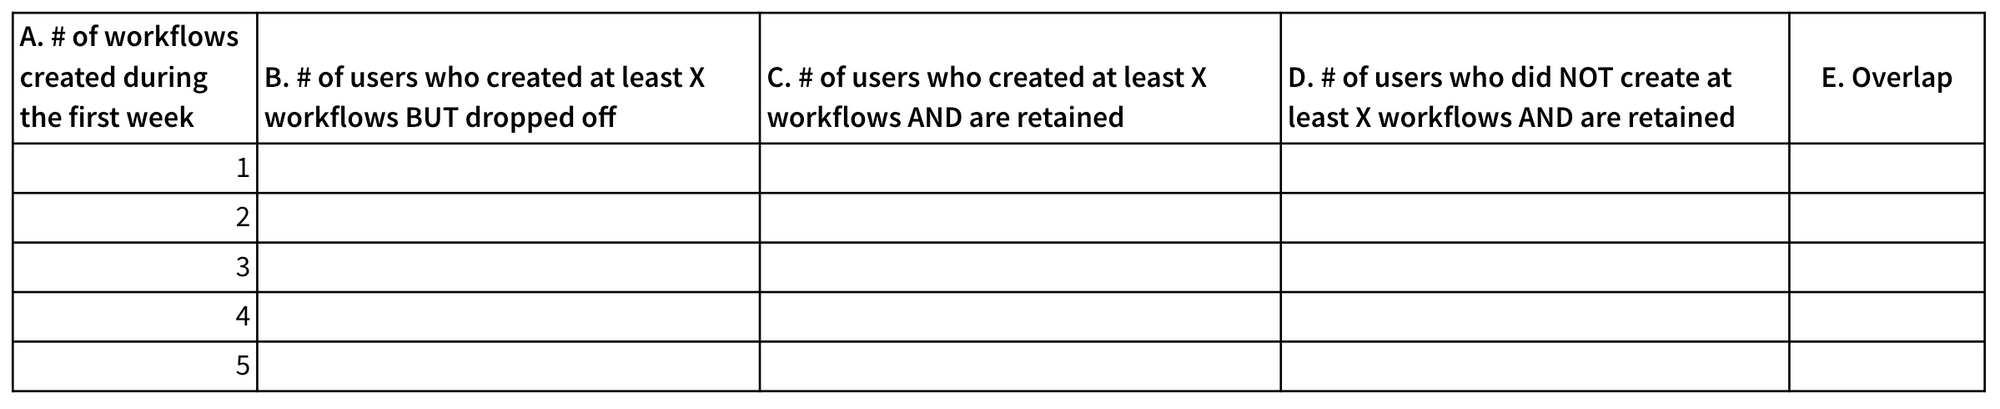
In this example, we picked up to 5 workflows. There’s no hard and fast rule of what frequencies you need to measure. Pick a range based on the product you are building.
Step 3: Do the math
Create a list of users who are retained and a list of users who dropped off. Go through the retained user list and measure the following numbers:
- How many of those users created at least 1 workflow during their first week.
- How many of those users created at least 2 workflows during their first week.
- How many of those users created at least 3 workflows during their first week.
- How many of those users created at least 4 workflows during their first week.
- How many of those users created at least 5 workflows during their first week.
The “at least” part is important here. This means a retained user who created at least 5 workflows during their first week will be included in all the rows for column C.
Again, go through the retained user list and measure the following numbers:
- How many of those users did not create at least 1 workflow during their first week (this is going to be all retained users who did not create even 1 workflow).
- How many of those users did not create at least 2 workflows during their first week.
- How many of those users did not create at least 3 workflows during their first week.
- How many of those users did not create at least 4 workflows during their first week.
- How many of those users did not create at least 5 workflows during their first week.
Now you are going to go through all users who dropped off and measure the following numbers:
- How many of those users created at least 1 workflow during their first week.
- How many of those users created at least 2 workflows during their first week.
- How many of those users created at least 3 workflows during their first week.
- How many of those users created at least 4 workflows during their first week.
- How many of those users created at least 5 workflows during their first week.
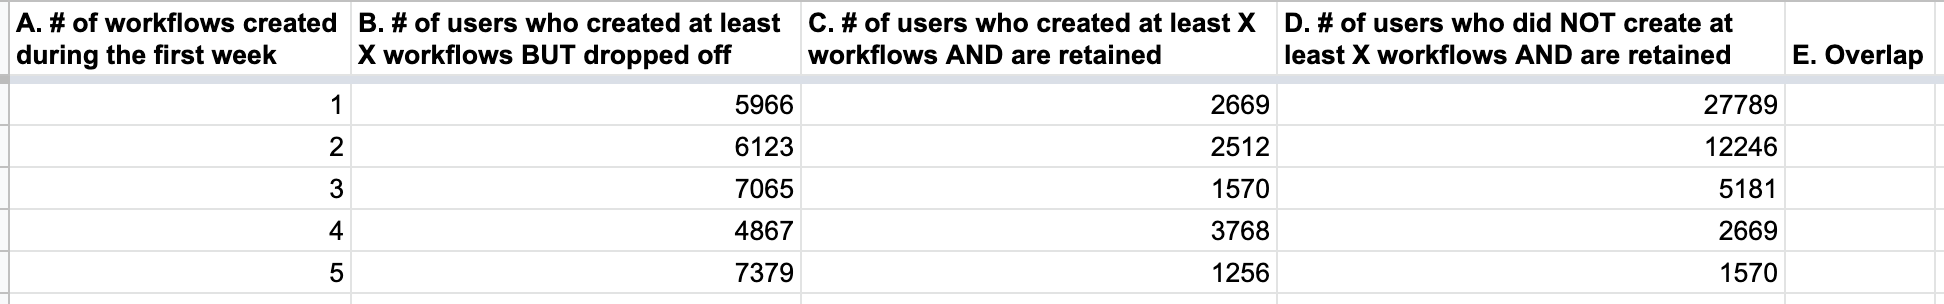
Now that you have measured all the numbers, fill out the table. Here are some made-up numbers that we are going to use to illustrate our example.
Step 4: Put it all together
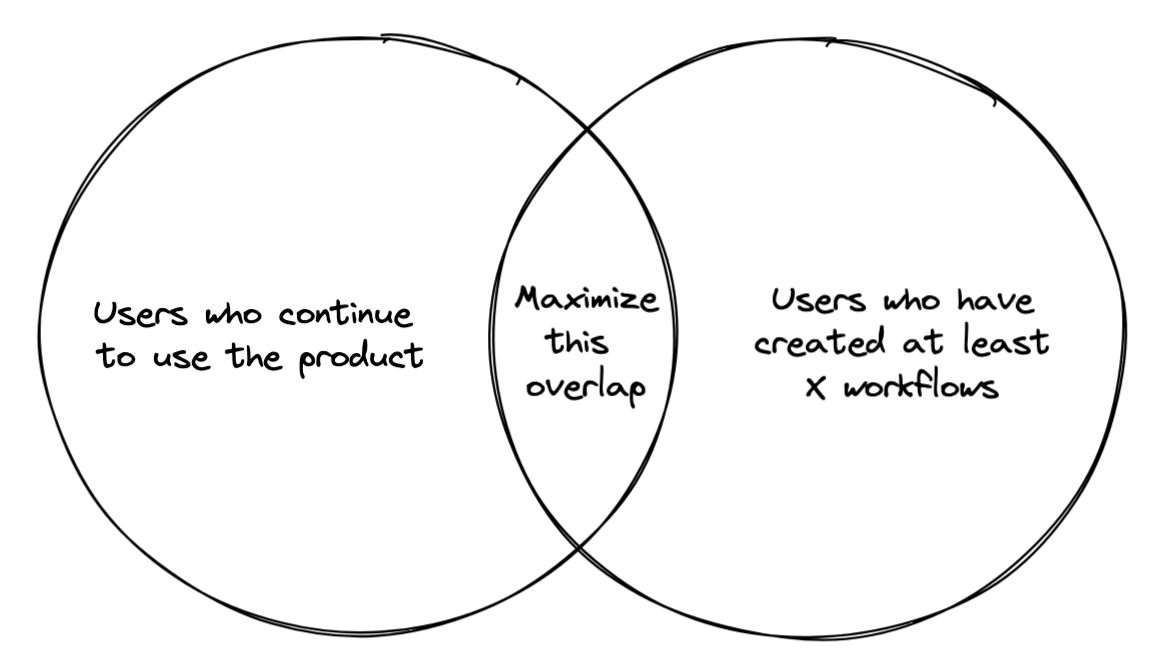
We are trying to find the largest overlap of users who created at least X workflows during their first week.
Go through each row and calculate the percentage of overlap. Here’s the formula to find that number:
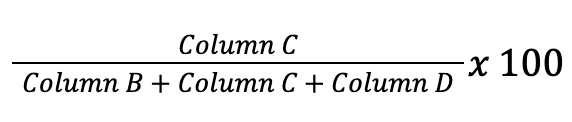
This will give you the overlap number for each row. The row with the highest percentage of overlap is the number that you are looking for.
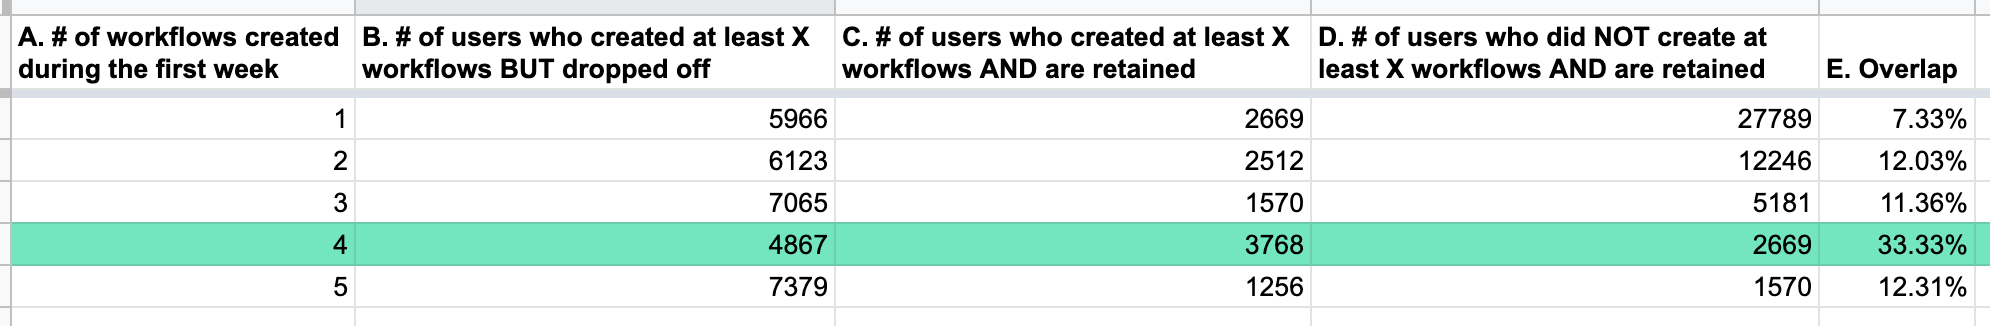
Notice how there is a 33.33% overlap for users who created at least 4 workflows and continue to use the product. That is our magic number. Therefore, if a user creates at least 4 workflows during their first week they are more likely to adopt the product than other users in the same cohort.
What are some things to look out for when picking a product adoption indicator?
Before we conclude, here are some things to watch out for as you continue your journey of finding the magic number.
Don’t settle on one core action. Look at other core actions in your product. Maybe there’s a stronger indicator than just the number of workflows created in the first week.
Time-bound core action. You want to know early in a user’s lifecycle if they find your product valuable or not. Pick a time boundary that gives your user enough time to be successful at using your product but not too long where you have to wait for several weeks or months to figure out if a new user will be successful.
Be ready to adapt. The core action and the magic number may change if you are growing or pivoting or are attracting a different user persona. So it’s important to visit this number every 3 months to see if you have a new (or a better indicator) magic number.
What’s next?
For our example, we looked at all users and measure 8-week retention (the prerequisite step). For our immediate next step, measure the 8-week retention rate by doing a cohort analysis on users who created at least 4 workflows during their first week. If you see that the 8-week retention rate for these users doubled or tripled compared to all the users, you have found your magic number. If that's not the case, go back to Step 1 and pick a different hypothesis and repeat the steps.