Why sharing network logs is important when reporting a bug
Picture this: You share a bug with an engineer, and they're asking for "network logs." Fear not, here are the steps to find and share dev logs - and why they're important.

Picture this: You share a bug with an engineer, and they're asking for "network logs." As a non-technical person, you might be scratching your head wondering what that even means. But fear not, understanding the importance of network logs can help you communicate more effectively with engineers and ultimately lead to quicker resolution of bugs. So, before we dive into why network logs are crucial, let's take a moment to break down what they are all about.
Bonus: Here are our recommended resources for product managers to become more technical.
What are network logs
When you are on your browser and enter “example.com”, a few things happen:
- The browser looks up the IP address of the domain example.com by making a DNS request.
- After it returns the IP address, now the browser knows where to retrieve the webpage from.
- The browser initiates a connection with the server hosting the website at the obtained IP address, typically using the HTTP or HTTPS protocol. For HTTPS connections, there will be a process of SSL/TLS handshake to establish a secure, encrypted connection between the browser and the server.
- Once the connection is established, the browser sends an HTTP request to the server, asking for the content of the webpage associated with the URL "example.com".
- The server processes the request and sends back an HTTP response containing the webpage content, which usually includes HTML, CSS, JavaScript, images, and other multimedia files.
- The browser receives the response and begins rendering the webpage by interpreting the HTML, CSS, and JavaScript code to generate the page's visual layout and interactive features.
- As the browser renders the page, it may encounter additional resource requests, such as images or external stylesheets. The browser sends additional HTTP requests for these resources, and the server responds with the requested files. The browser then continues rendering the page with the received resources.
- Once the browser finishes rendering the webpage, it displays the fully loaded page to the user. The user can now interact with the webpage, navigate to other pages on the site, or perform actions like submitting forms or clicking buttons.
From 4-6 where we are talking about “HTTP requests” and “HTTP responses” are generally referred to as network requests. And when the browser logs them they are called network logs.
Why they are important
To grasp the significance of network requests and why they matter, let's consider an analogy: Picture yourself at a restaurant, where you (the client) peruse the menu and choose your meal. You relay your order to the waiter (akin to the network request), who then ferries it to the kitchen (the server). The kitchen whips up your dish (the requested data) and hands it off to the waiter, who delivers it to your table (the response). In this context, the network request serves as a go-between, linking you with the kitchen and facilitating the communication and delivery of your meal.

Now, envision a scenario where the waiter brings you the incorrect dish. How would you deduce the reason for the mix-up? Chances are, you'd check the logs. In a restaurant setting, logs exist in two locations: 1) the notes taken by the waiter when recording your order, and 2) the order book the chef consults before starting to cook. This is precisely why network logs are vital when an engineer tackles a front-end bug.
By examining the network logs, engineers are almost always able to identify the underlying problem—whether it's a page that won't load, images that are broken, or error messages confronting users.
Besides network logs, a complete bug report includes:
- Network requests
- Console
- Reproduction steps
- Expected results
- Actual results
- Severity and priority of the bug
- Screenshot or video of the UI bug
Here's a free bug reporting template for QA and PMS.
Where you can find network requests to report a bug
You can find the network logs by opening the developer console window in your browser. In this blog post, we are going to share a step by step instructions on how to reveal the network logs when you load a web page.
Step 1: Open your developer console window
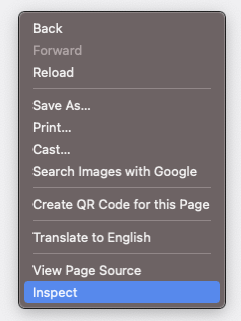
You can open the developer console window by using the keyboard shortcut command+option+I or by right-clicking on the page and then clicking on 'Inspect'.
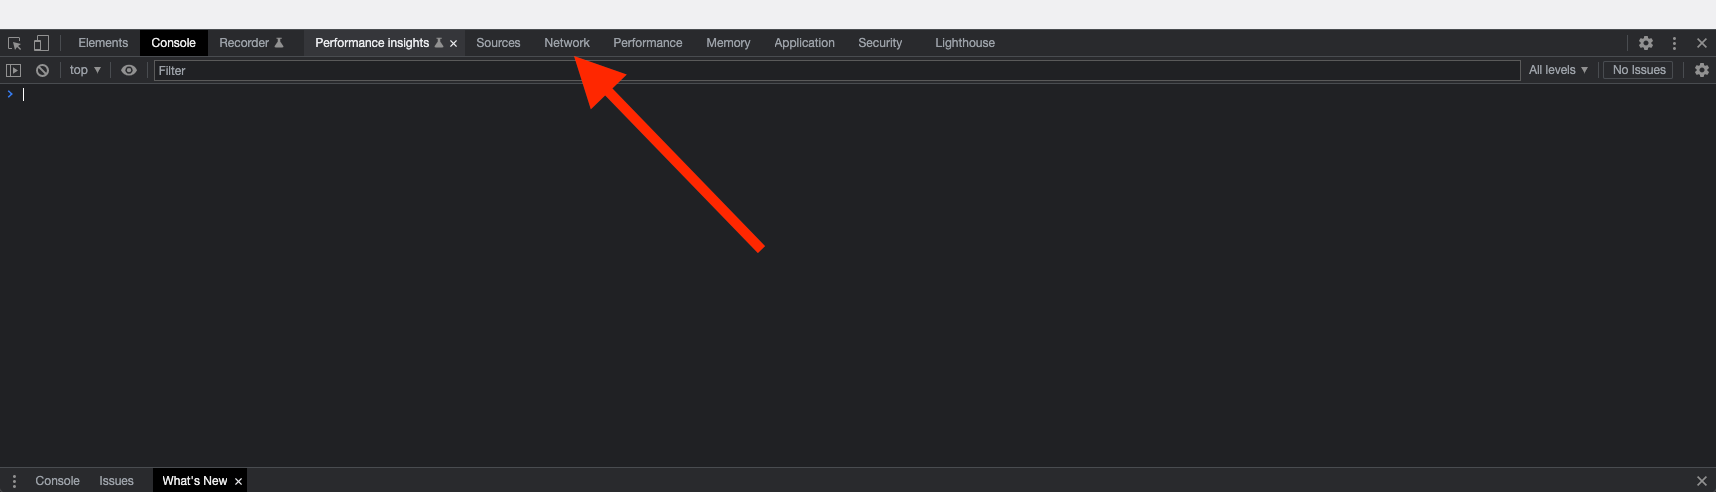
Step 2: Click on the network tab
After you open the developer console window, click on the tab with the word 'Network' to view the network logs.
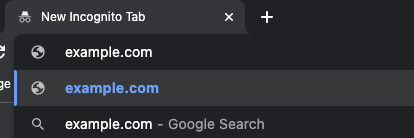
Step 3: In the URL bar, type the website and hit enter
Once the network tab is open, enter the URL of the website that you want to investigate. In our case, it's example.com.
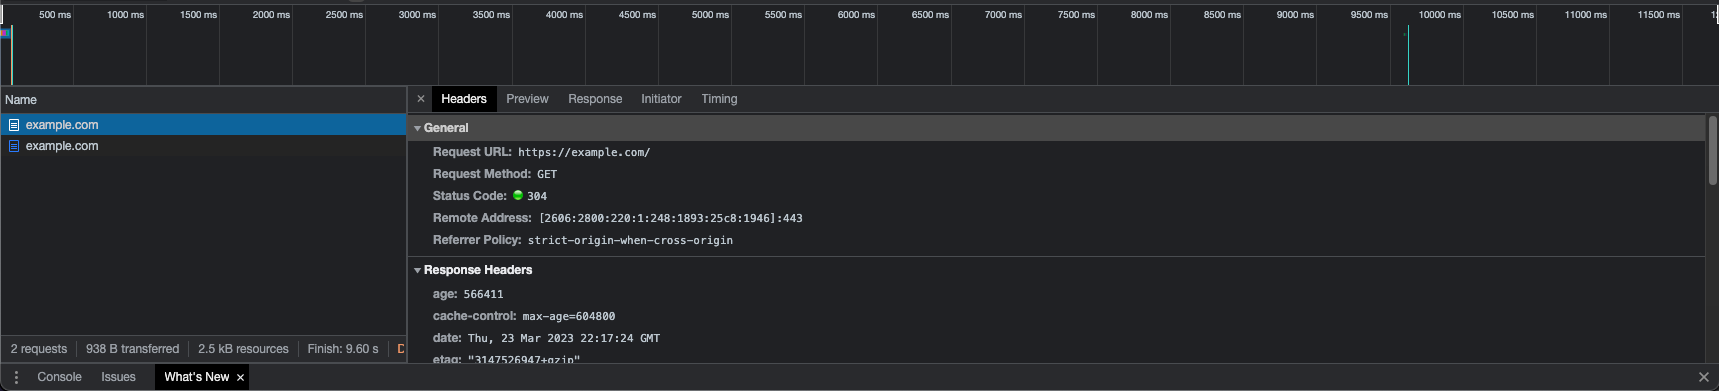
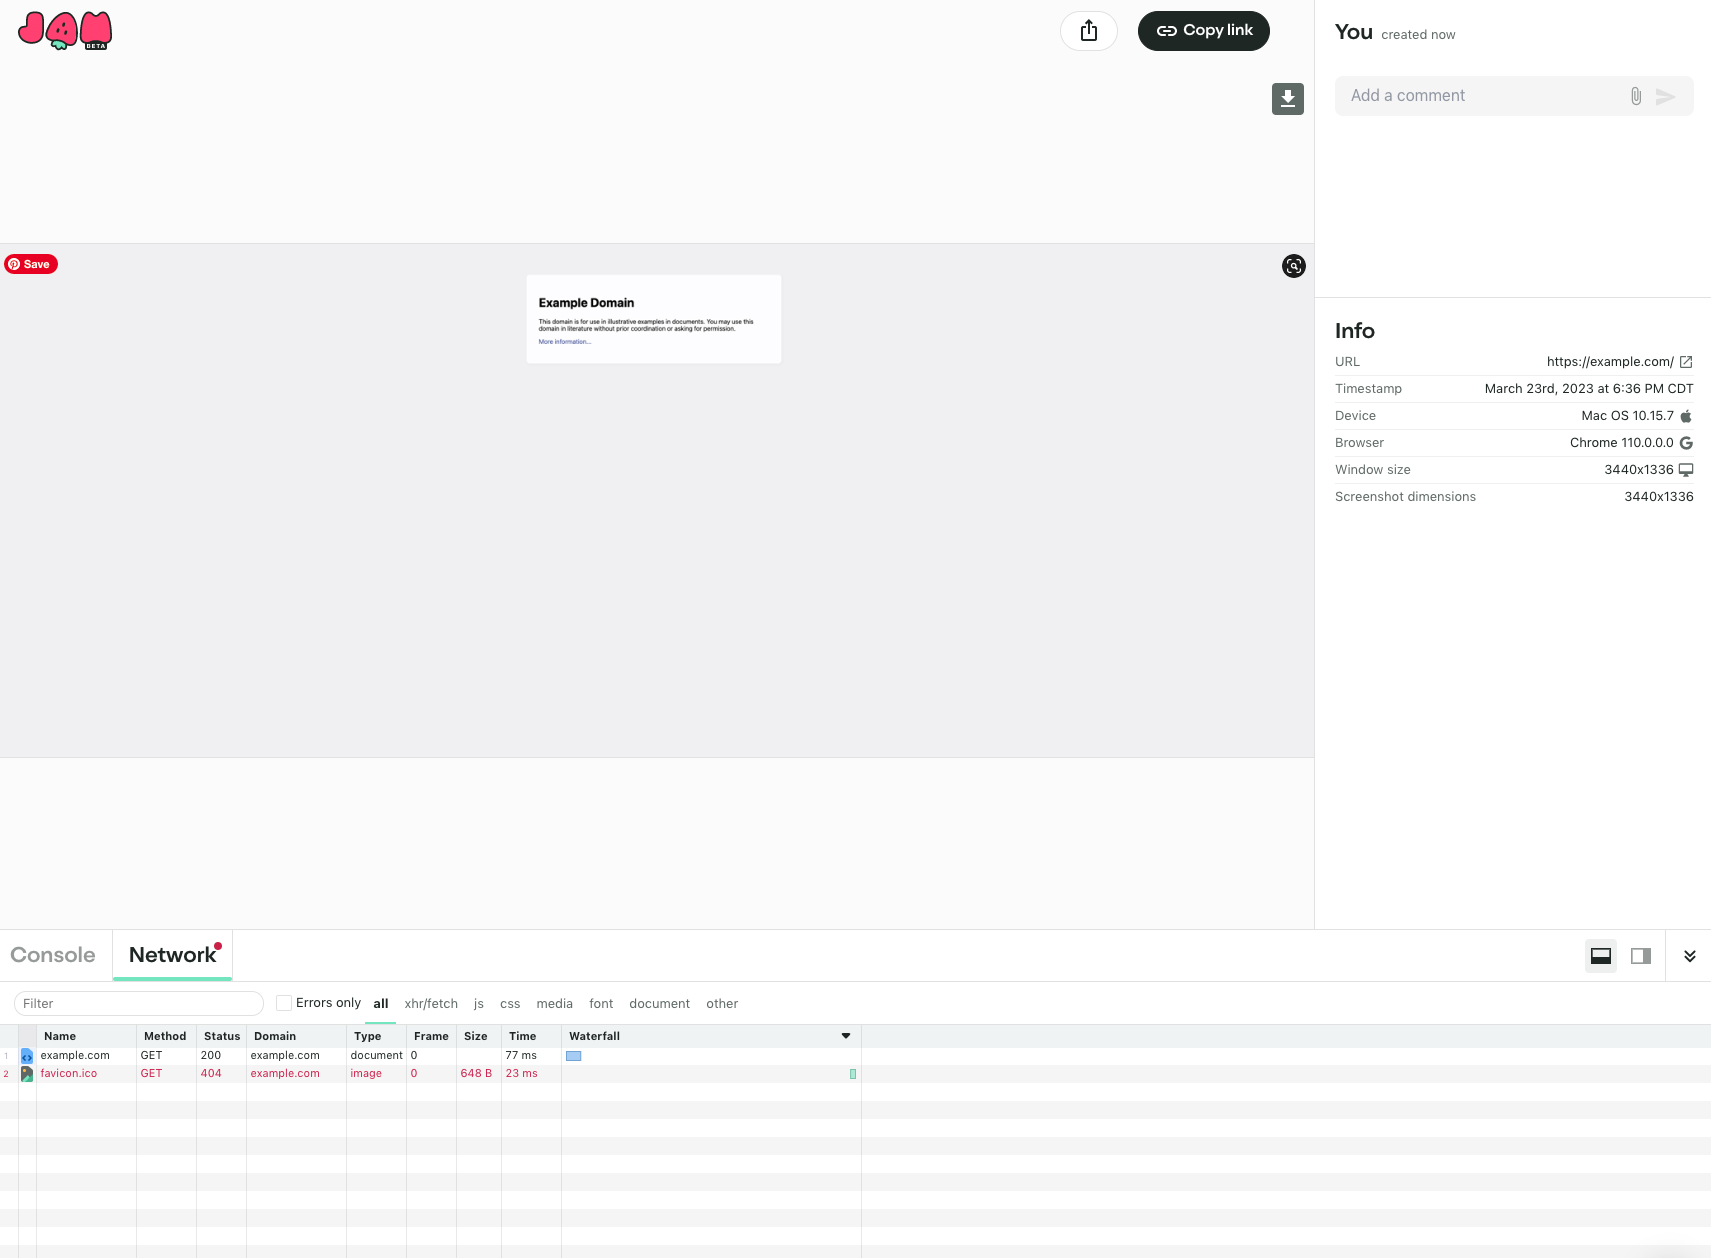
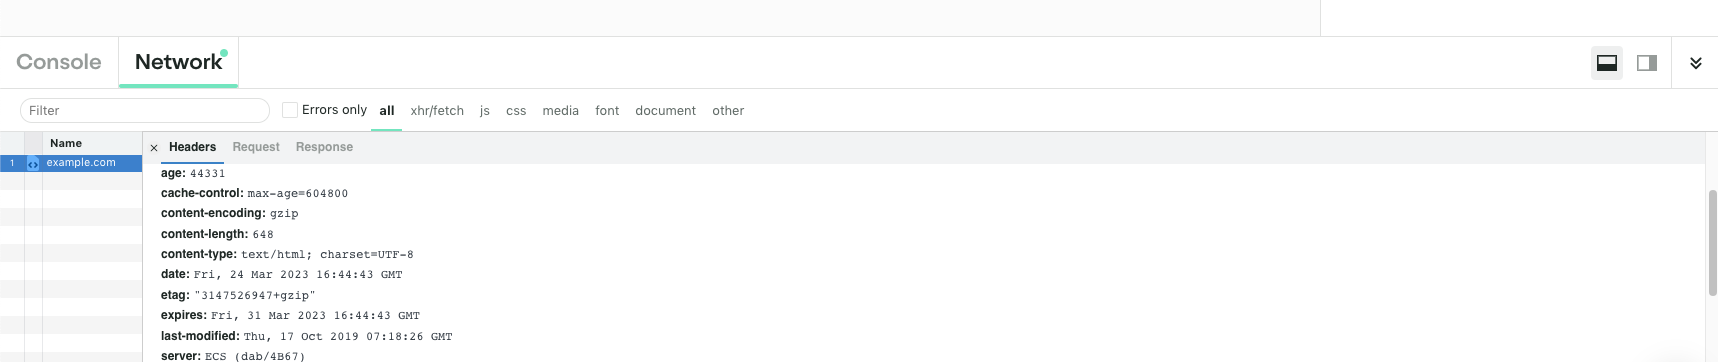
Step 4: Click to view network requests
After you hit enter, you will notice the Network tab being populated by network requests. You can click on them individually to inspect the request further.
How to share network logs with your engineers
Now that you know how to find the network logs, you are probably wondering how to share them easily with engineers. There are tools for bug tracking automation, including helpful Chrome extensions, that can do a lot of this for you. At Jam, we made it super simple for anyone to capture all the information (including network logs!) an engineer needs to solve a bug.
If you are using the Jam Chrome extension, once the page is loaded, click on the icon to open the menu.
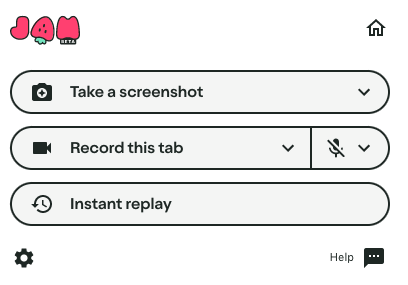
Doesn't matter what option you choose, Jam will automatically capture the network requests. In this case, we will click on "Take a screenshot".
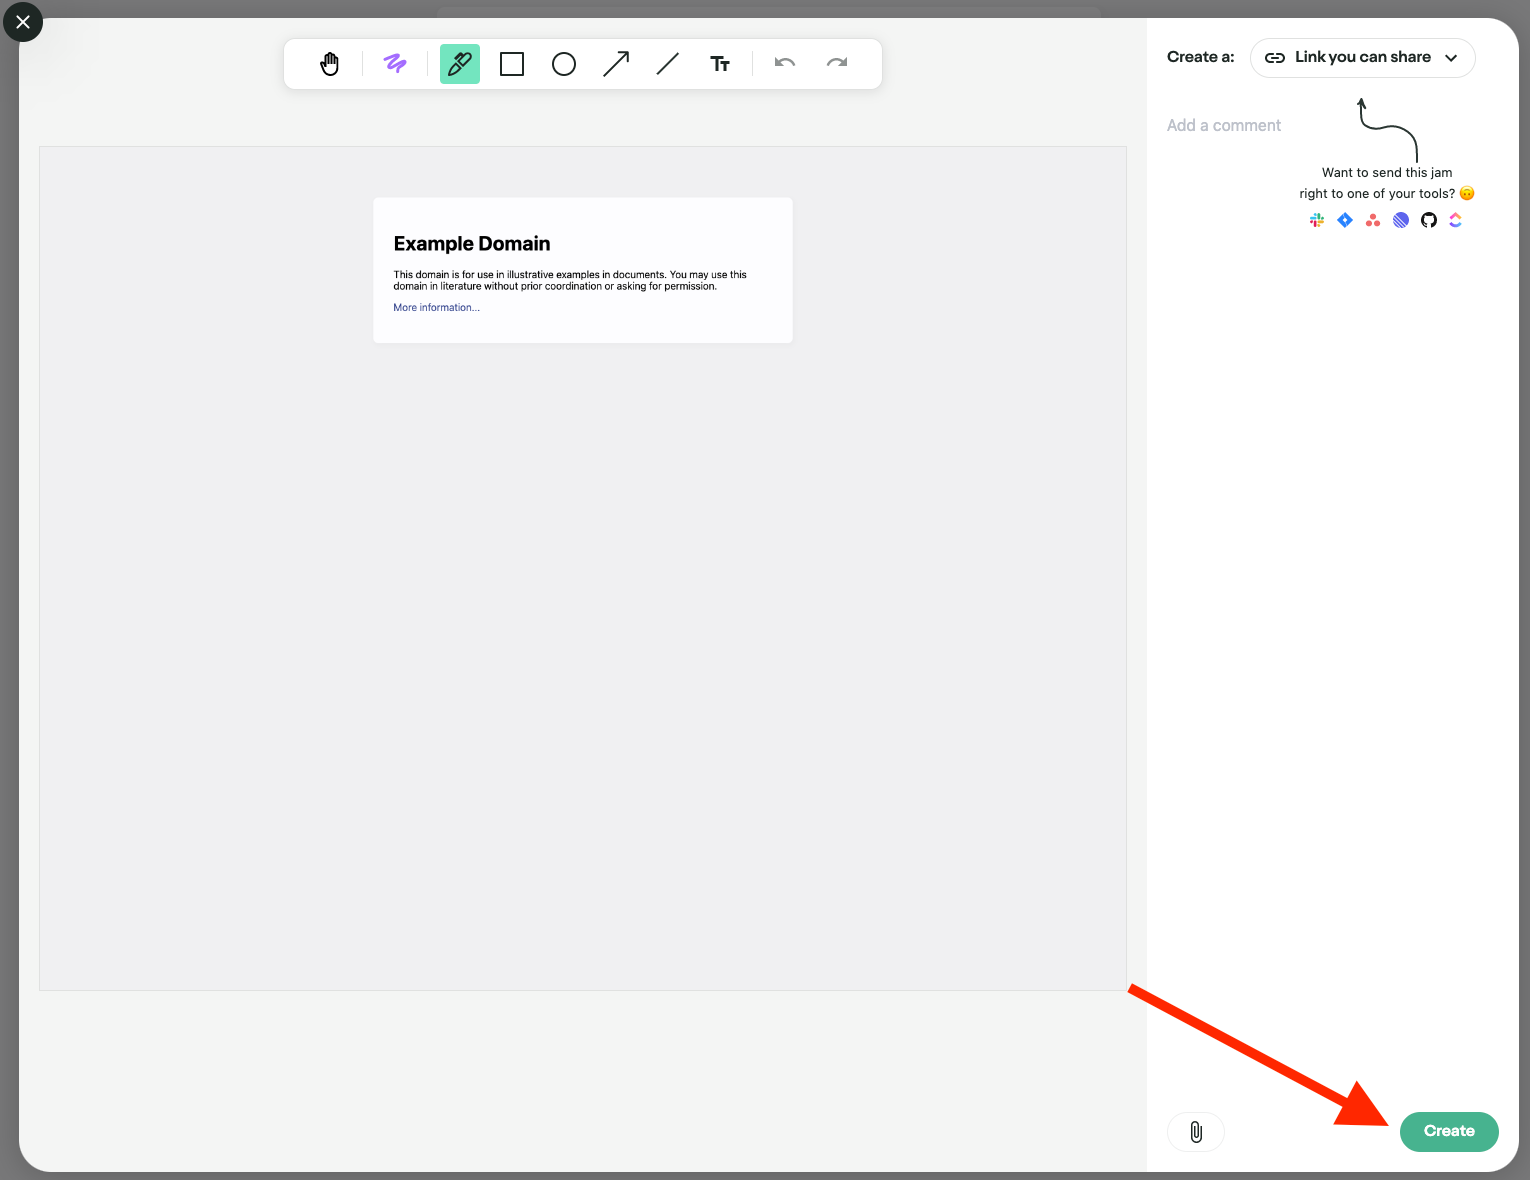
After you hit 'Create', Jam will create a link for you with the screenshot, device information, console logs, and network requests.
You now easily share this link with your engineers (Jam automatically copies the newly create link onto your clipboard!).
You can download it and start using it for free by using this link: https://jam.dev.
Of course, if you prefer a more manual approach, you can always take a screenshot or copy and paste the logs. However, this method has its limitations. You might not always know exactly what logs the engineers are looking for, which can slow down the resolution process. So, if you want to streamline your workflow, boost developer productivity, and get faster results, give Jam a try.