
Core Features
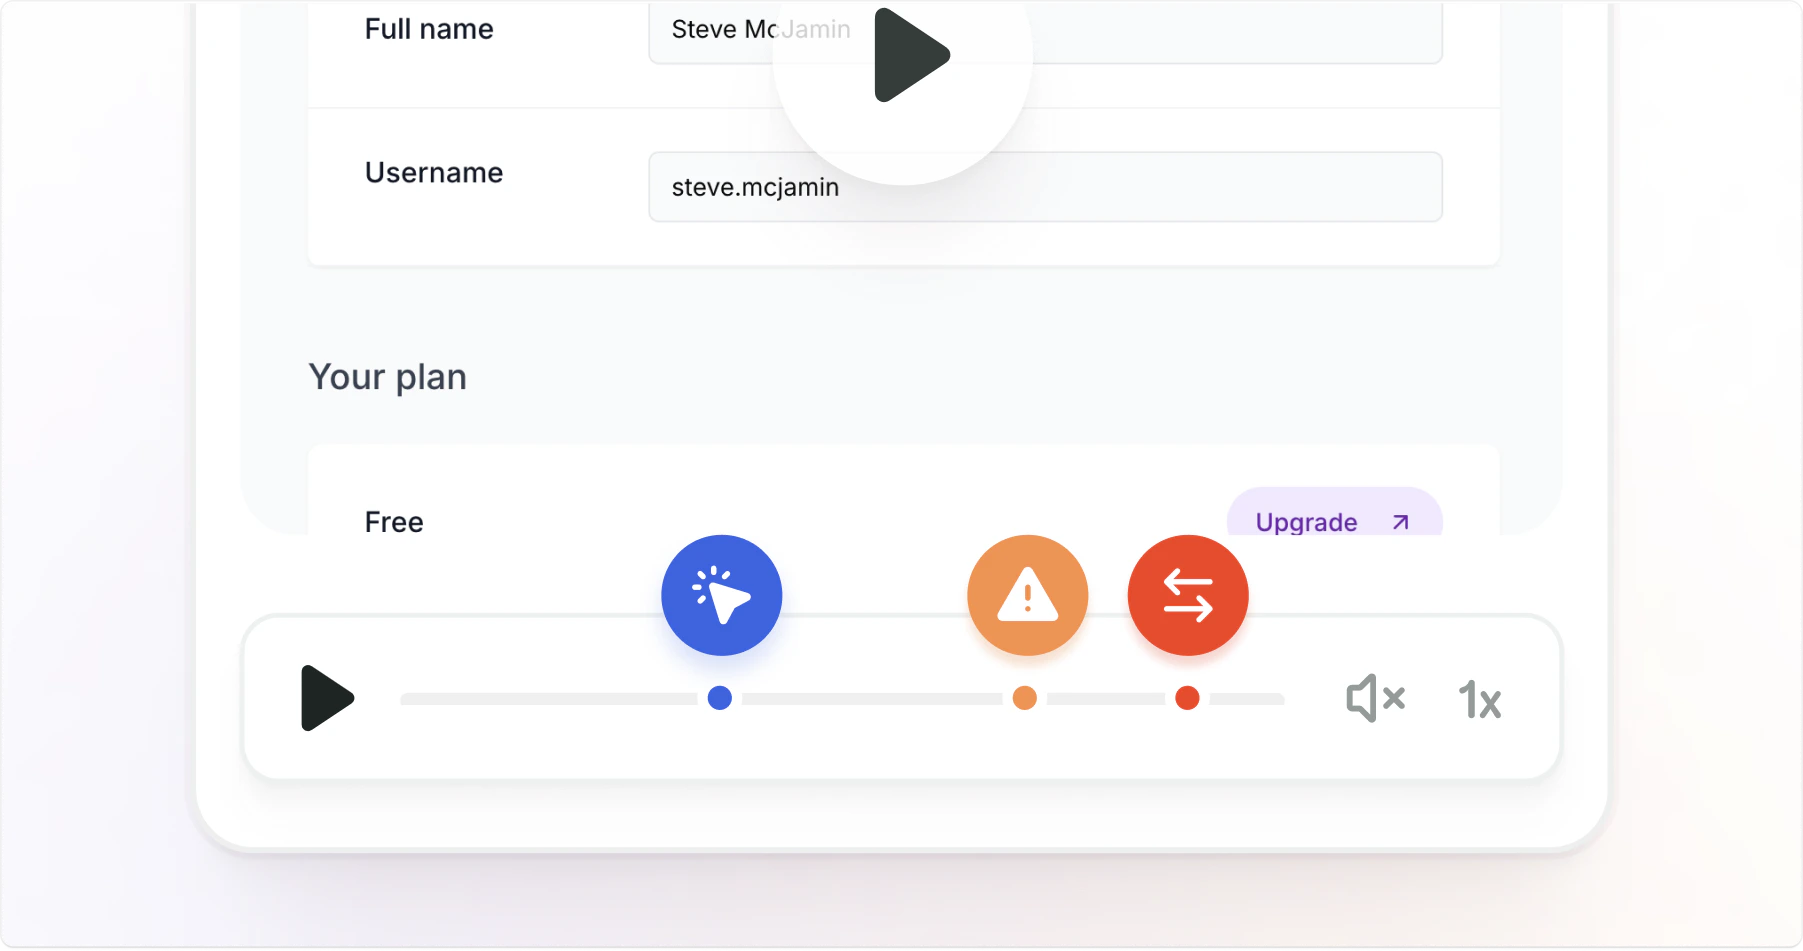
Visual context
Screenshots and screen recordings with annotation tools
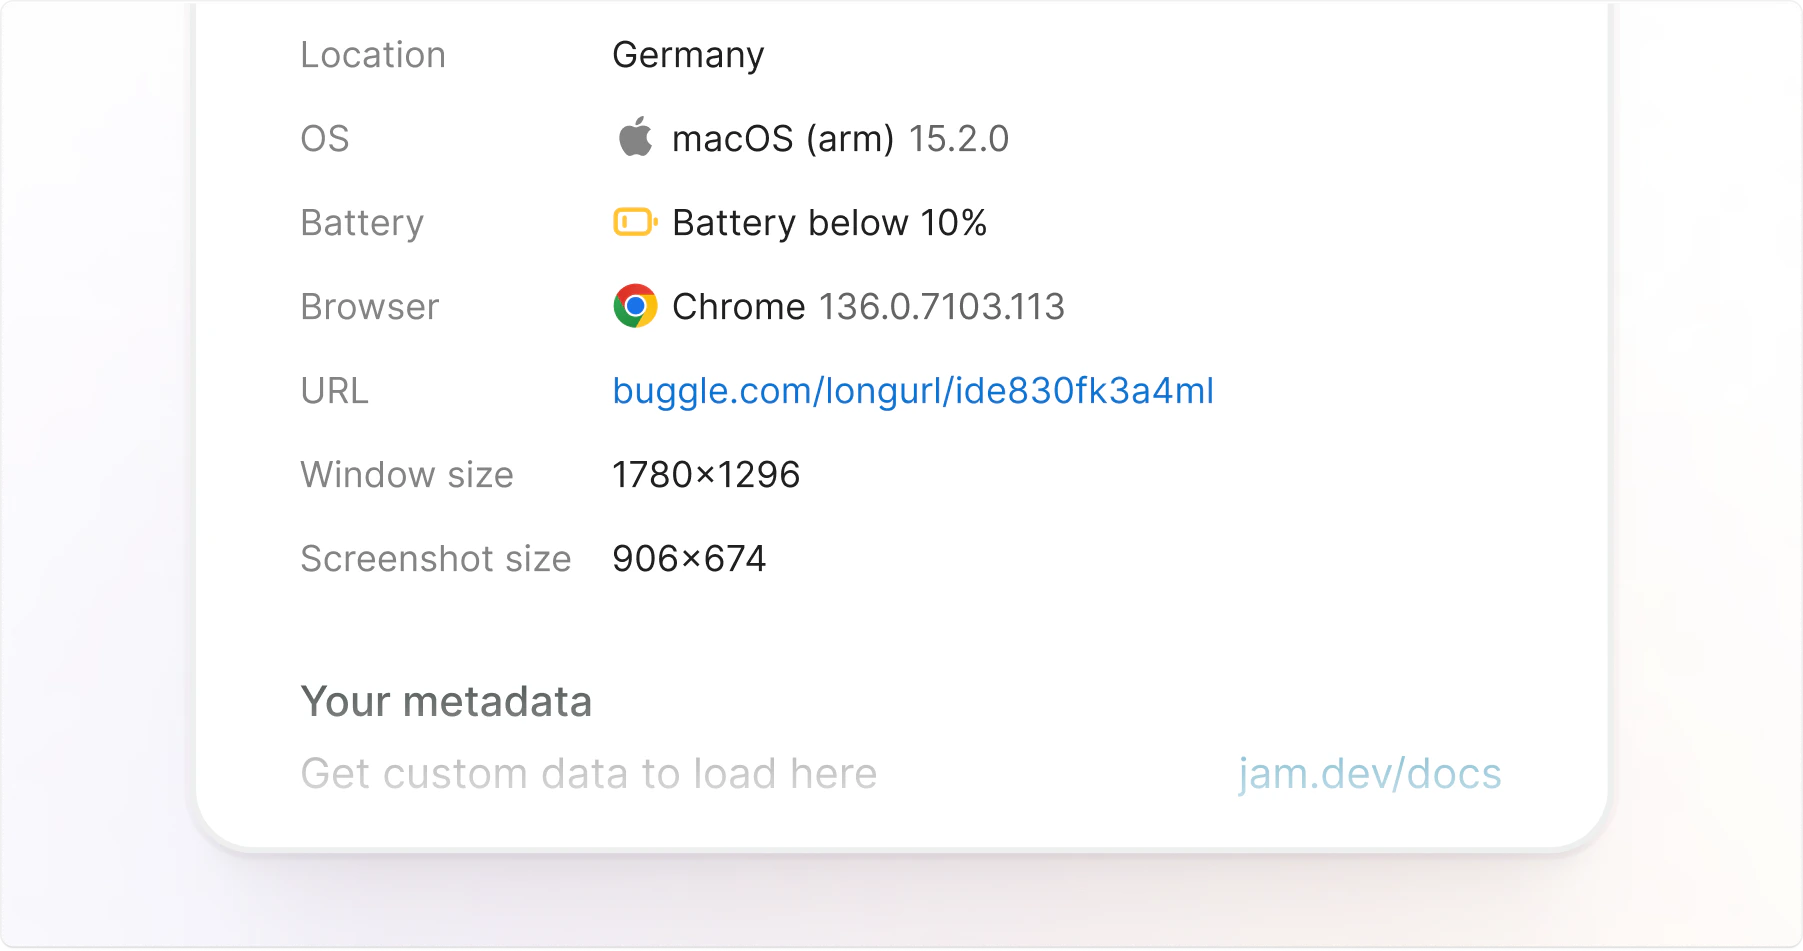
Custom Logs
URL, timestamp, device info, browser version, OS and more
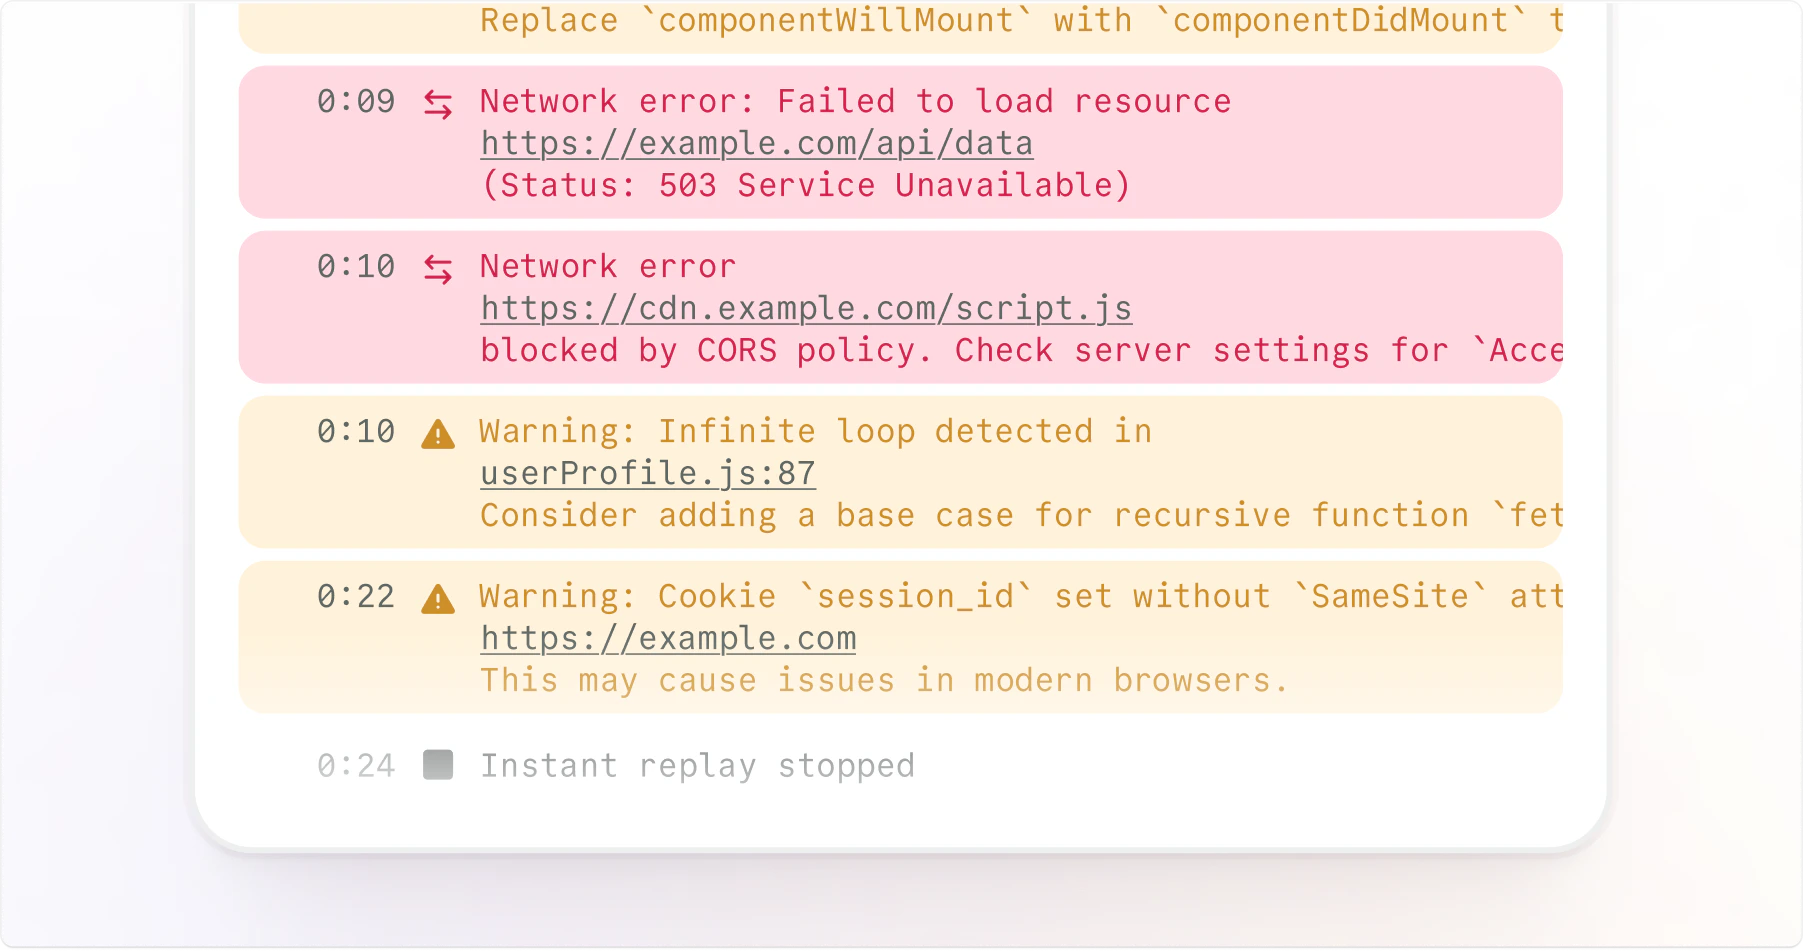
Developer logs
Console logs and complete network request details and more
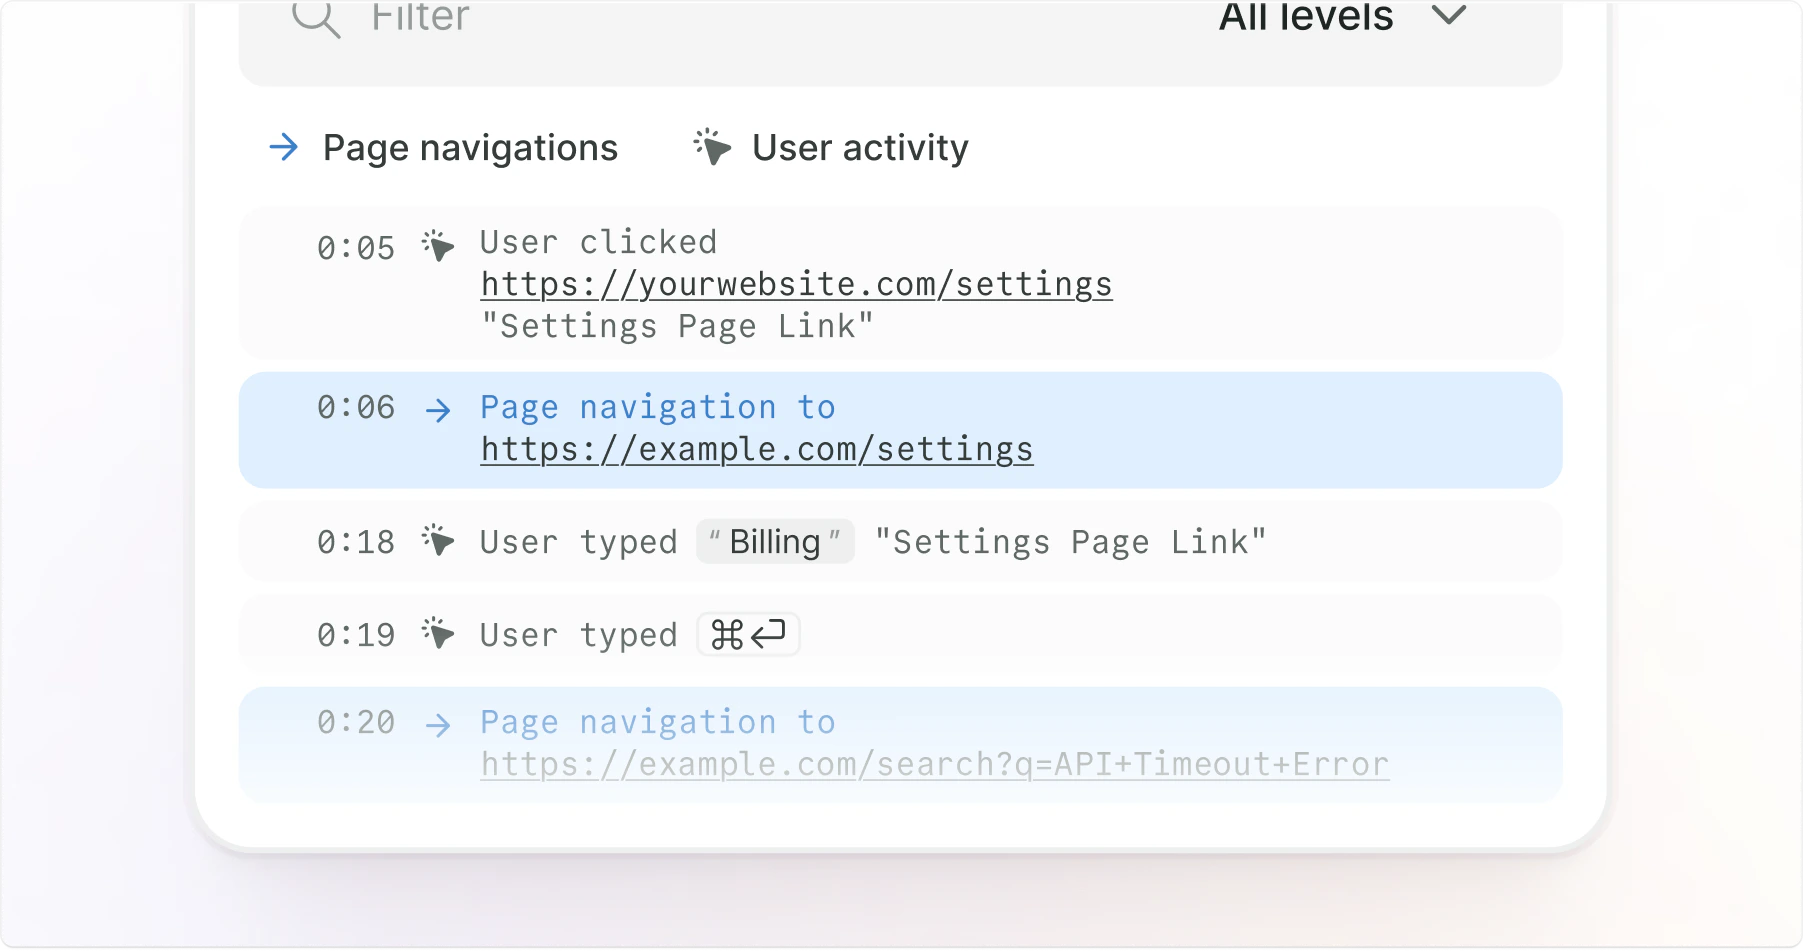
User events
Clicks, navigation events, and more
MCP
Send DevTools context to AI agents so they can inspect logs, network requests, and user events.
Layouts
Switch between side and bottom layouts to fit your workflow:- DevTools visible
- Content only
DevTools appear on the right side in the properties panel for wide-screen debugging. Ideal when you need to see both the captured page and technical details simultaneously.
FAQs
Do I need to enable DevTools manually?
Do I need to enable DevTools manually?
No. DevTools data is automatically captured with every Jam. No setup or configuration required. You can capture additional meta data with Custom logs.
Can I filter console logs by severity?
Can I filter console logs by severity?
Yes. Use the severity filter to show only errors, warnings, or specific log levels that matter for debugging.
How detailed is the network timing data?
How detailed is the network timing data?
You get complete timing breakdowns including DNS lookup, connection time, and response duration, matching the data engineers expect from Chrome DevTools.