

What’s inside
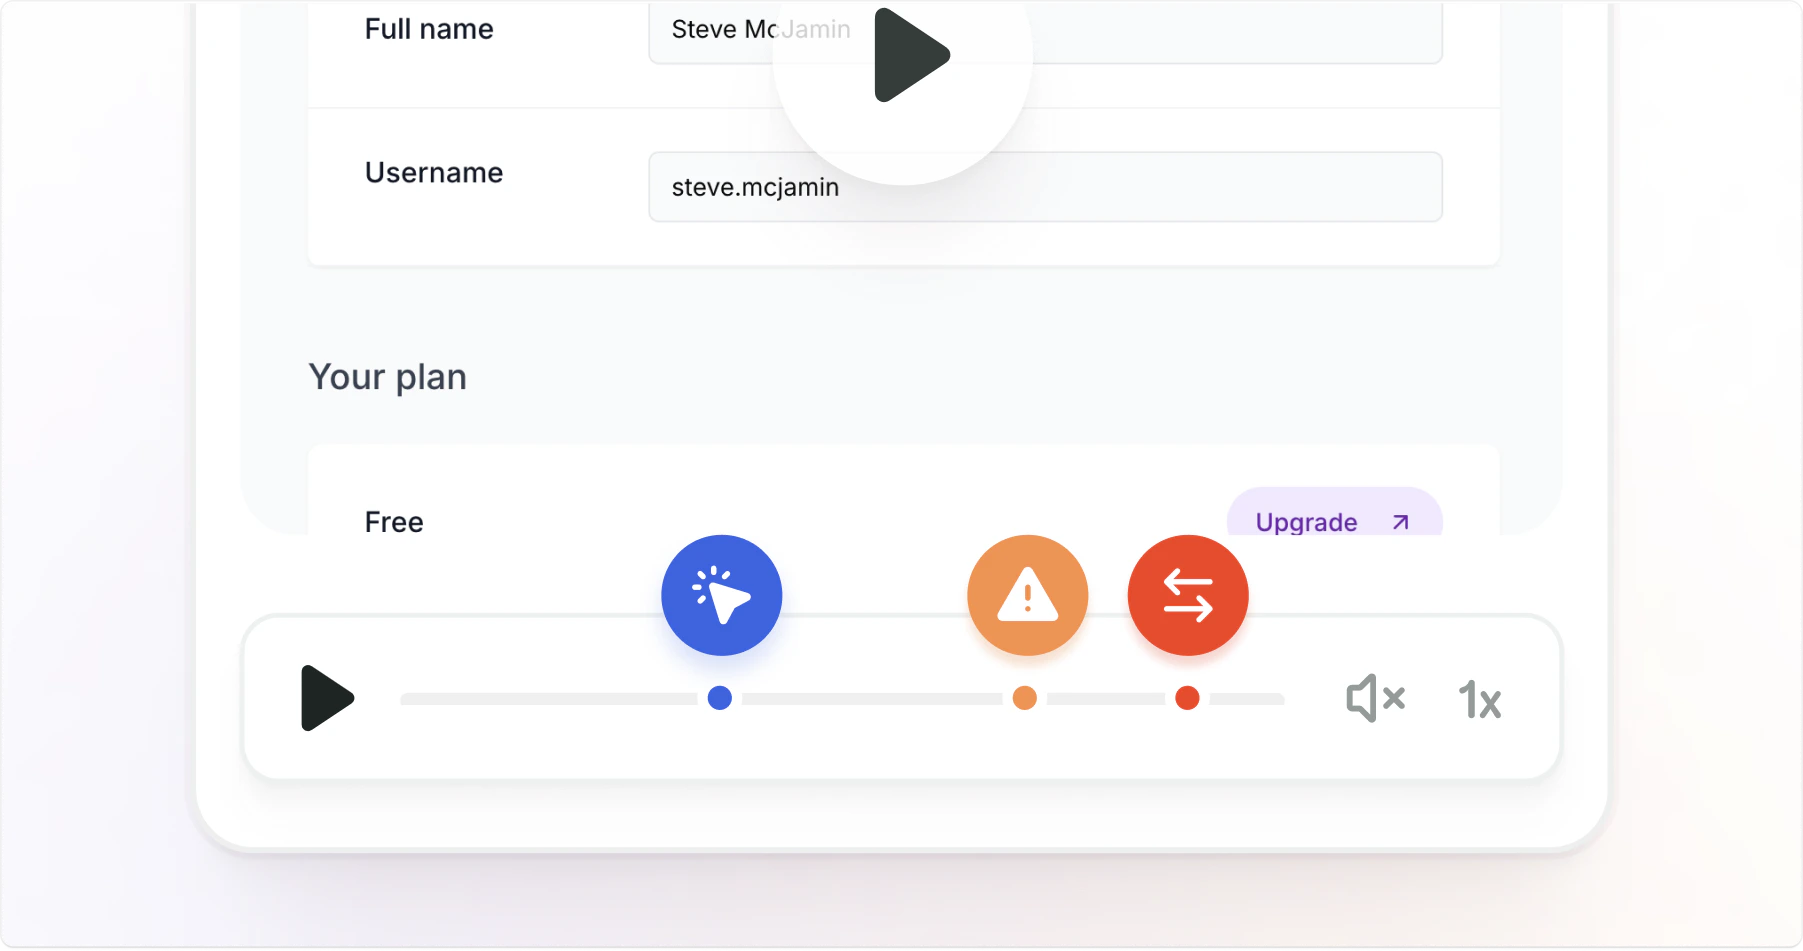
Visual context
Screenshots and screen recordings with annotation tools
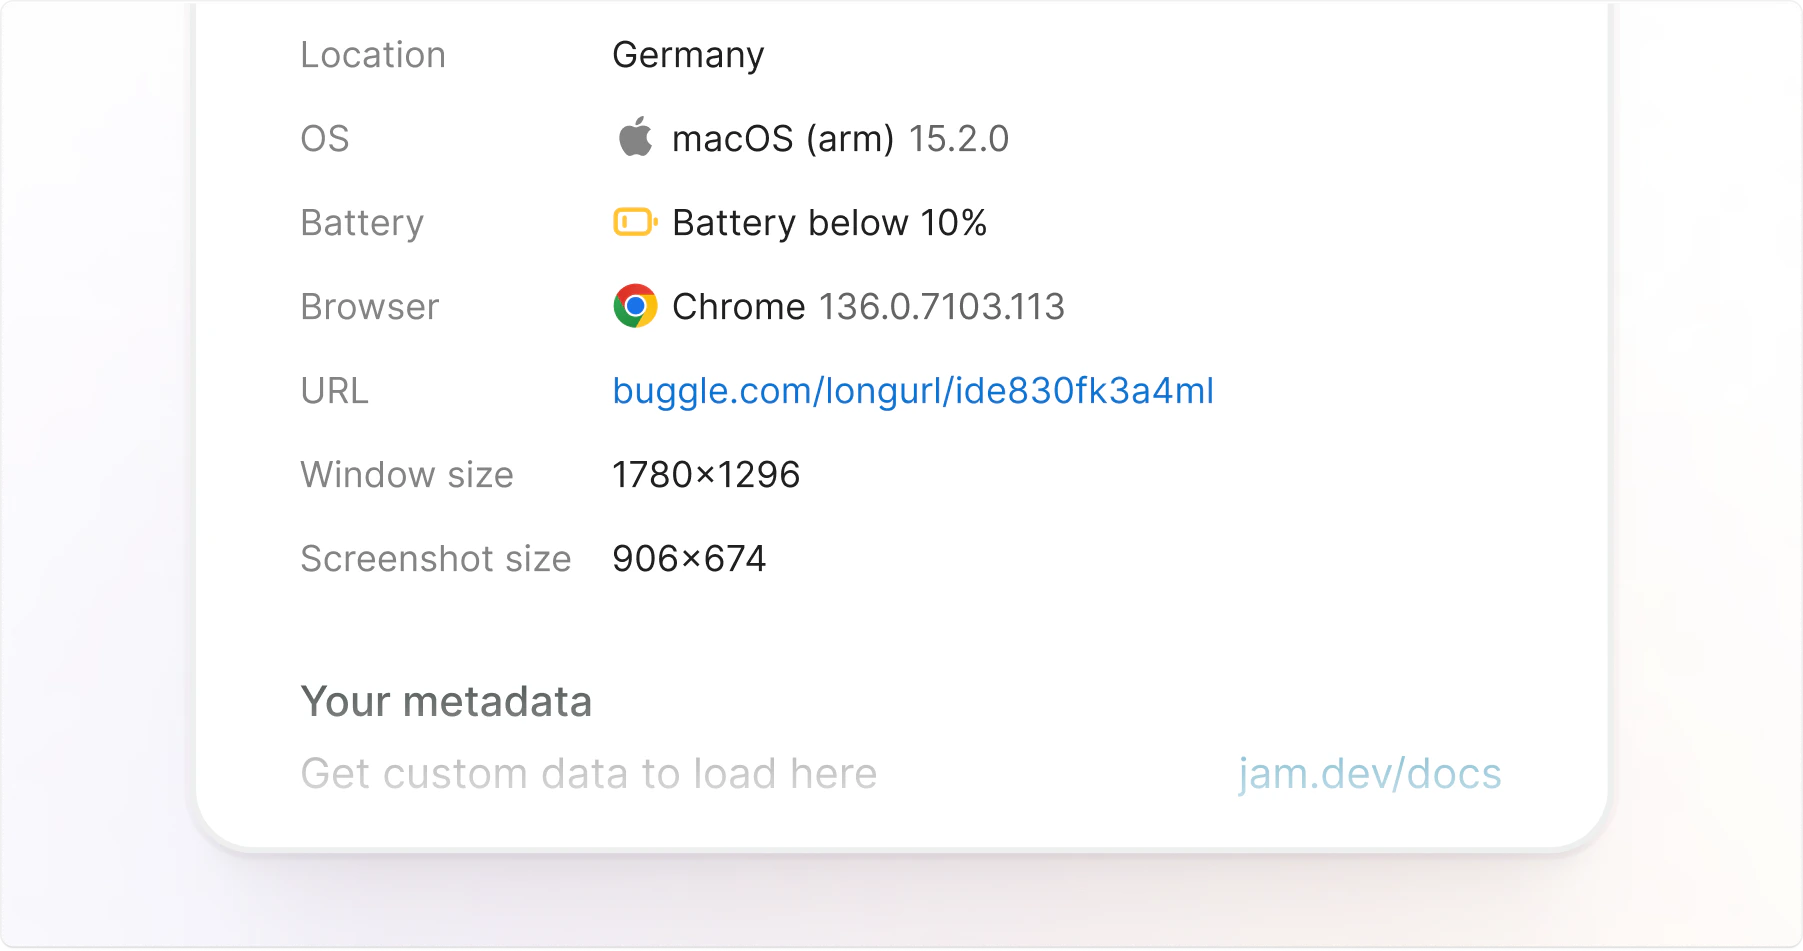
Custom Logs
URL, timestamp, device info, browser version, OS and more
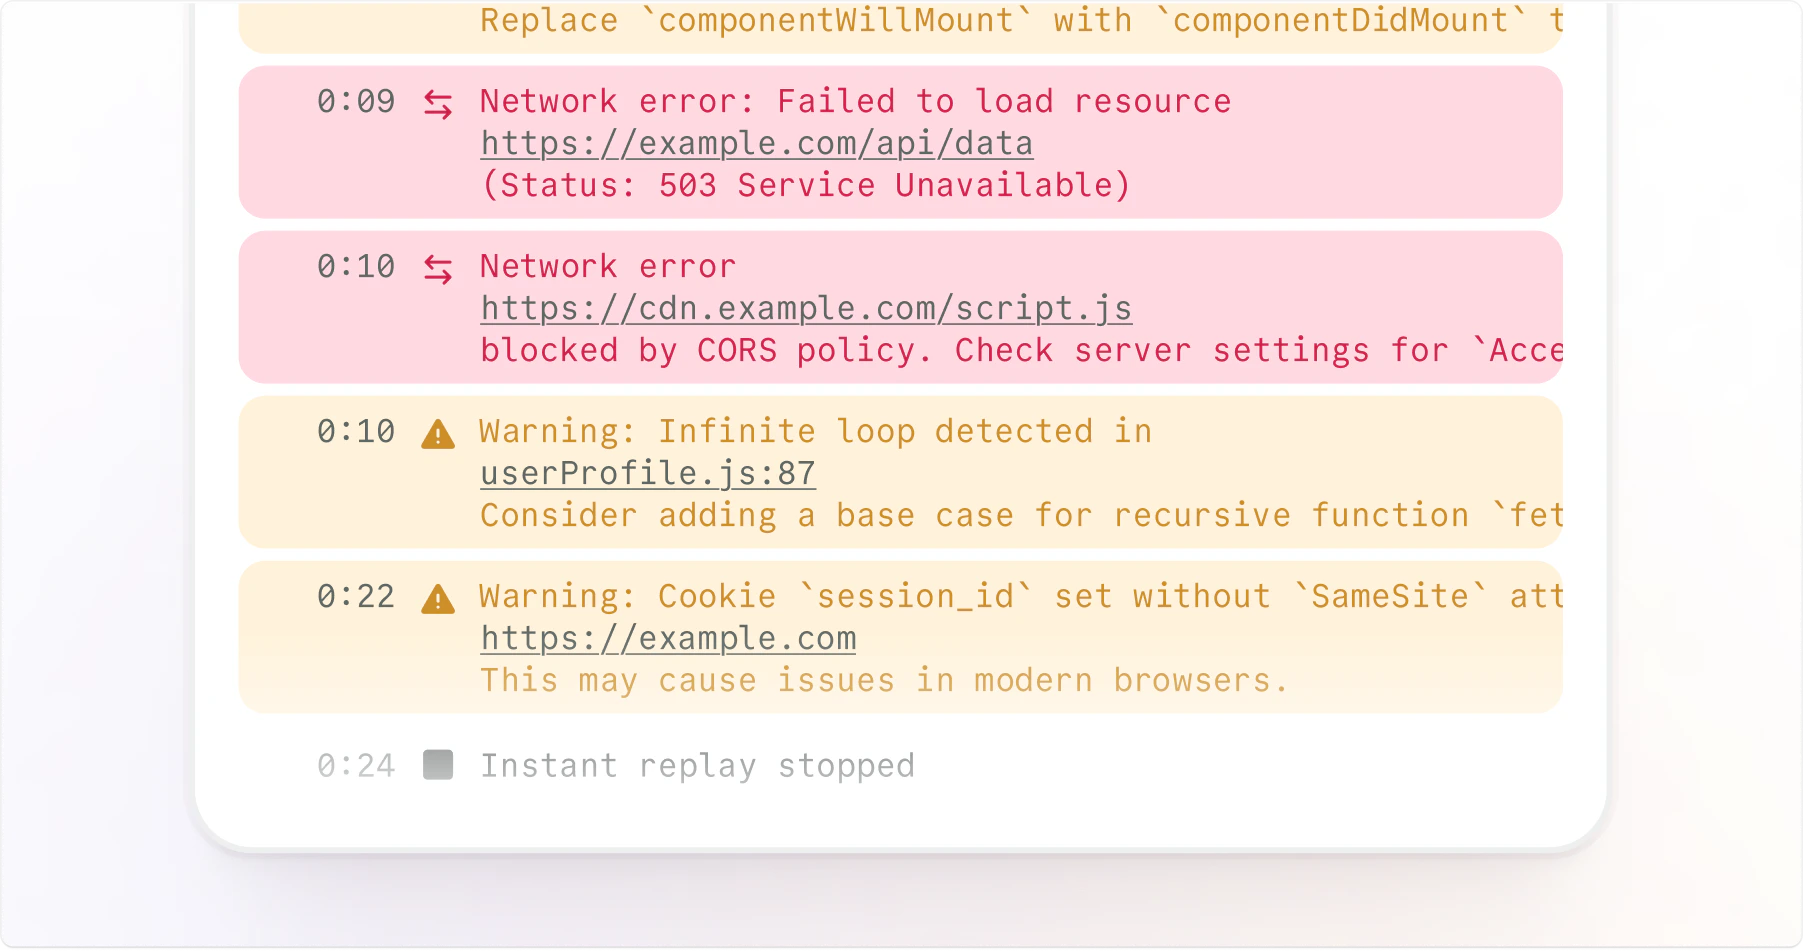
DevTools
Console logs and complete network request details
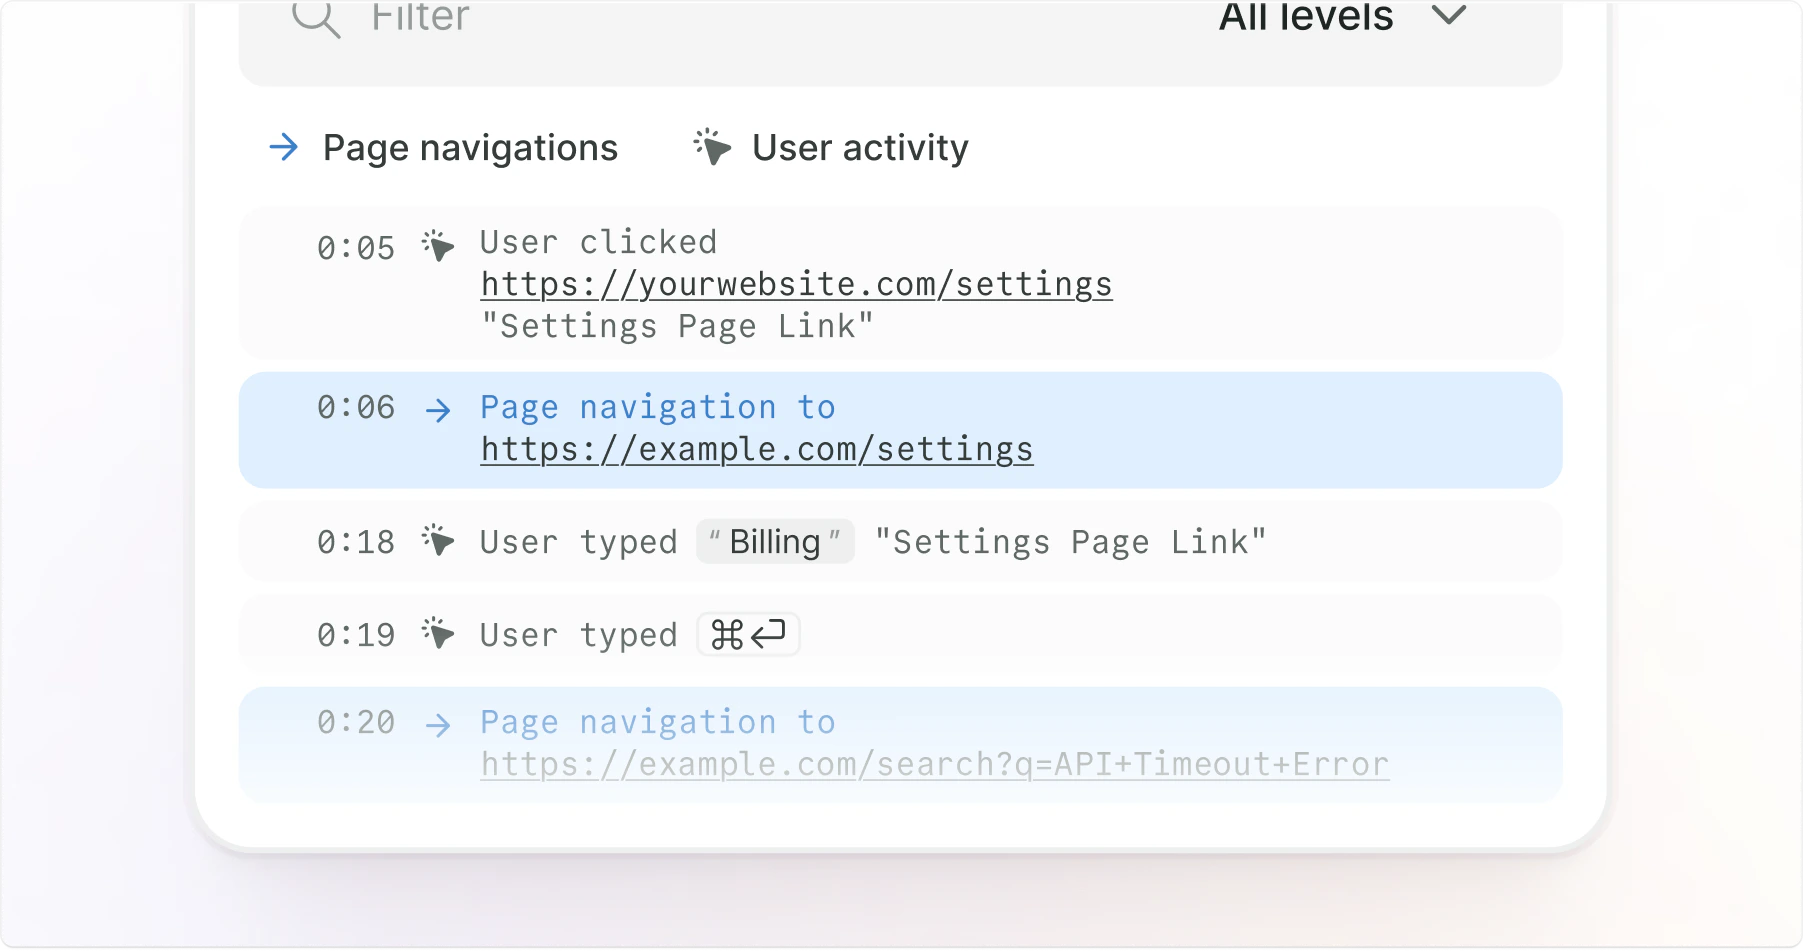
User events
Clicks, navigation events, and more
MCP
Send DevTools context to AI agents so they can inspect logs, network requests, and user events.
Layouts
Switch between side and bottom layouts to fit your workflow:- DevTools visible
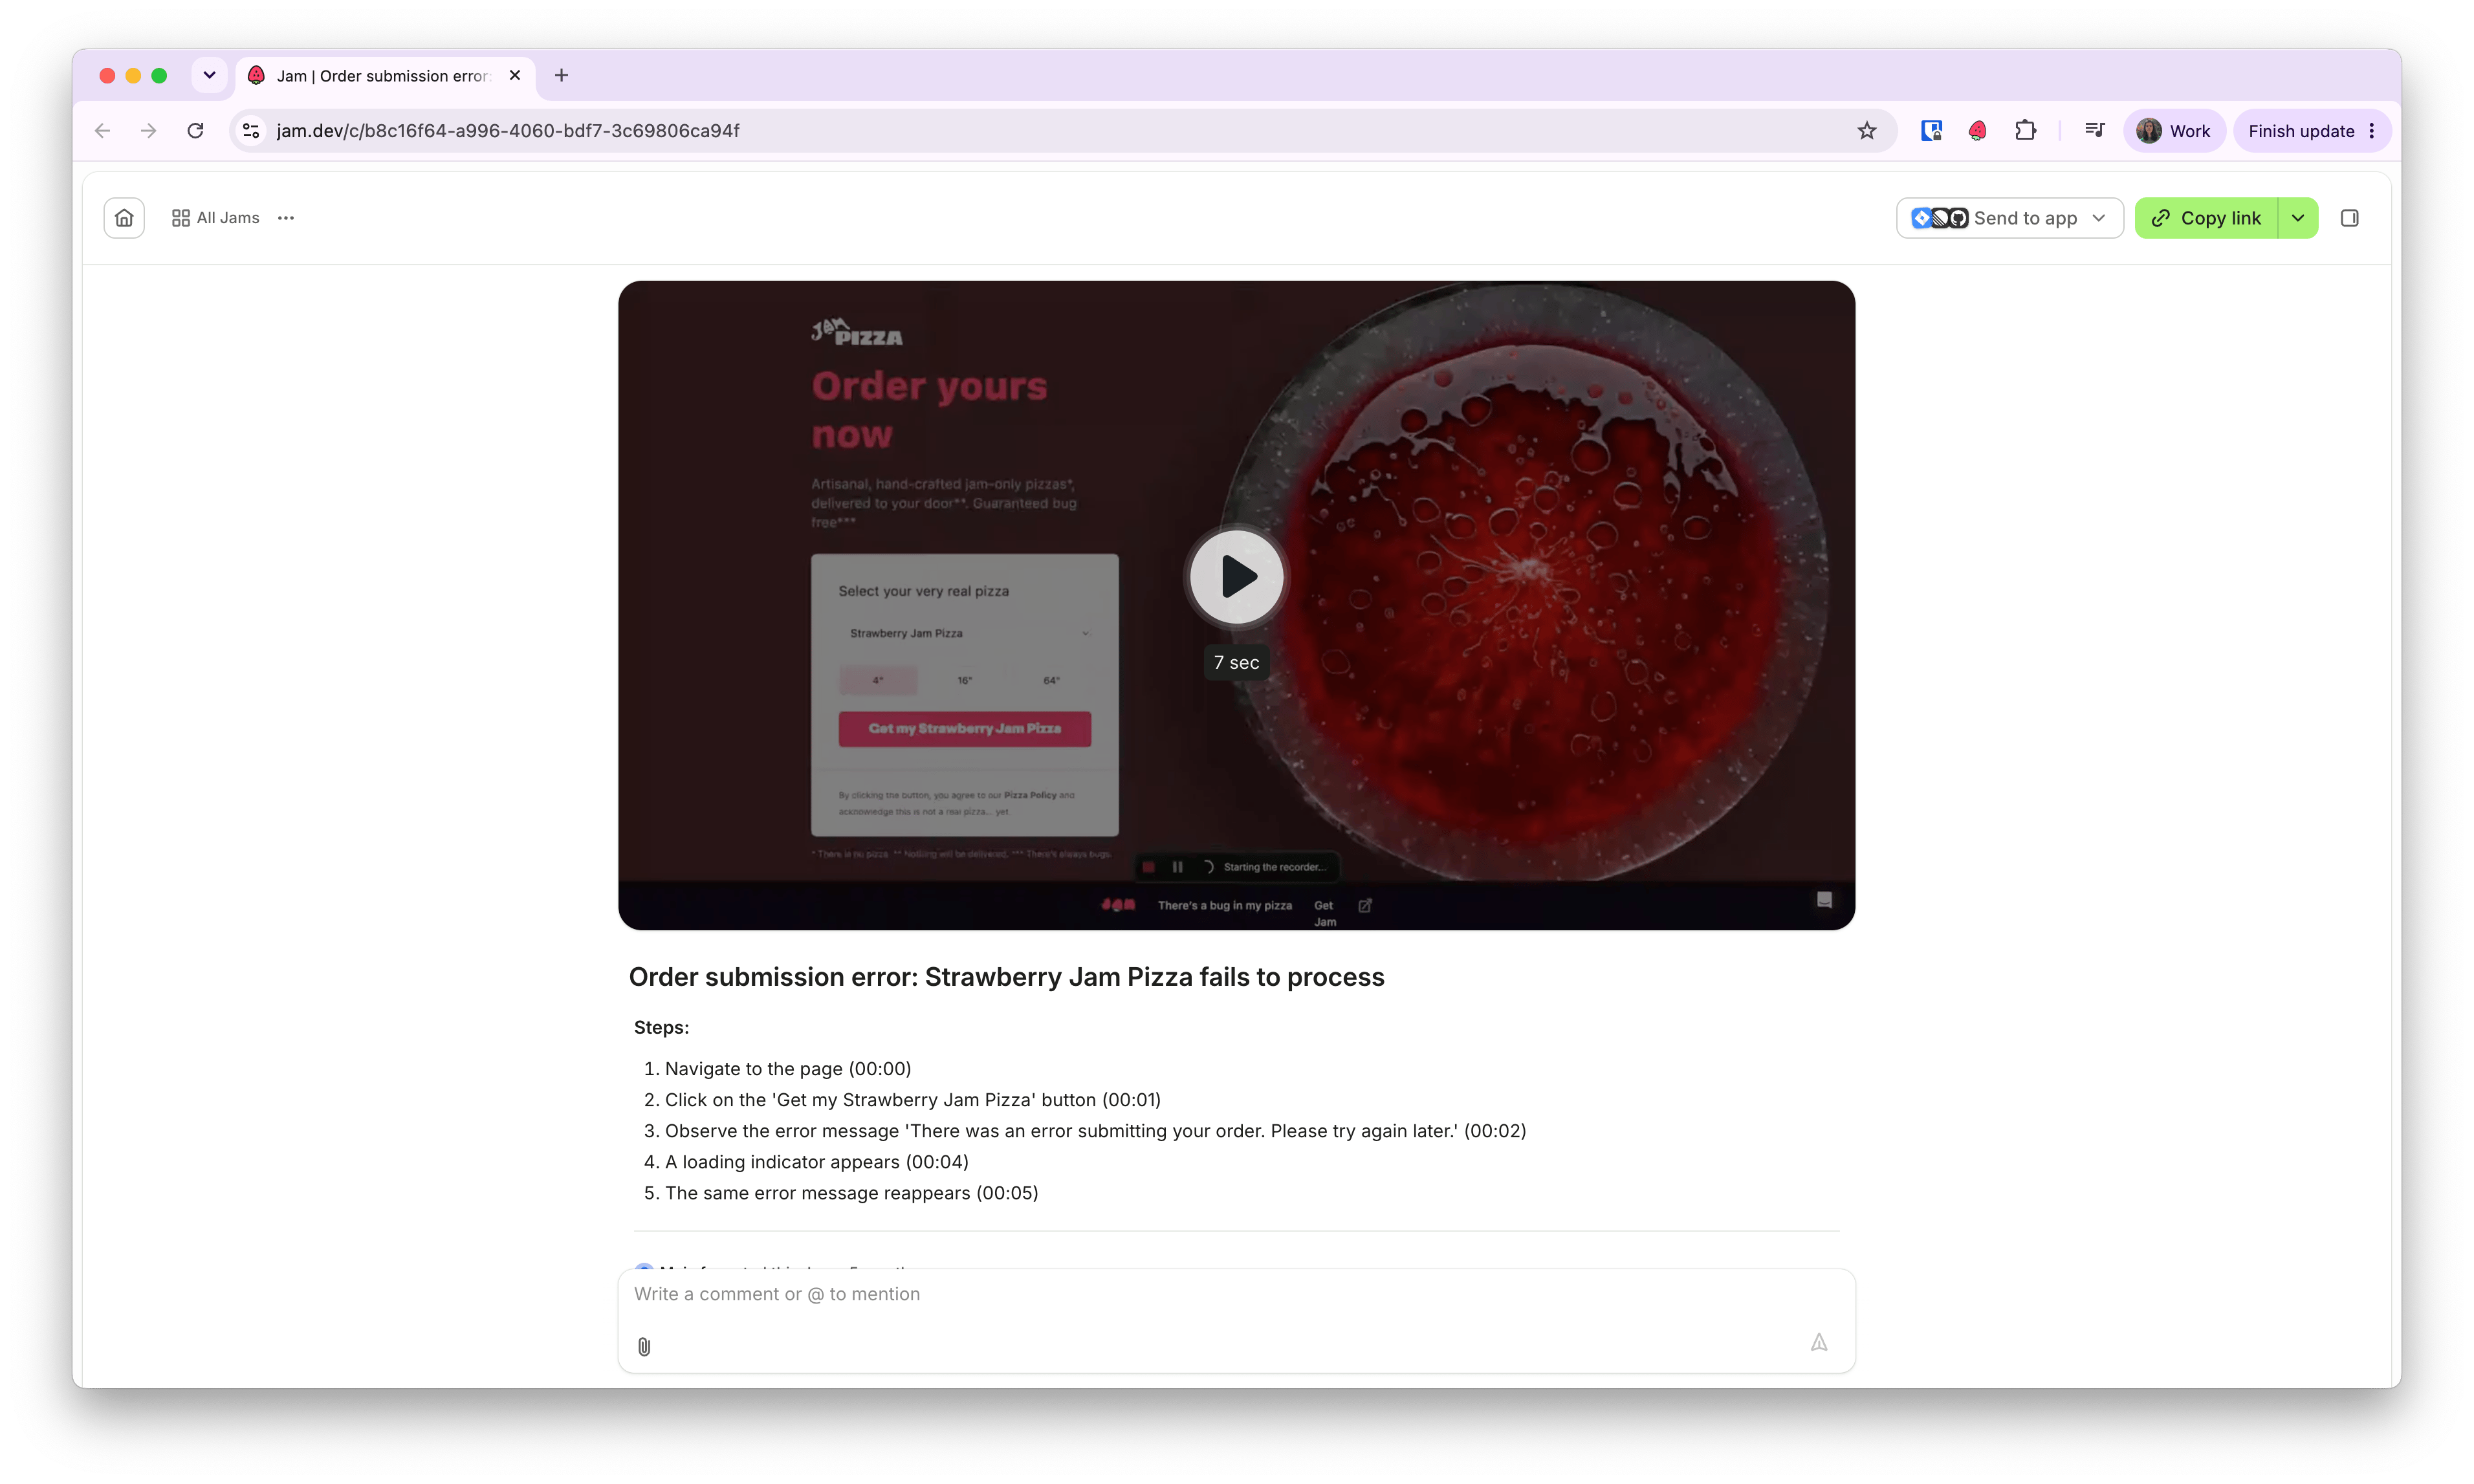
- Content only
DevTools appear on the right side in the properties panel for wide-screen debugging. Ideal when you need to see both the captured page and technical details simultaneously.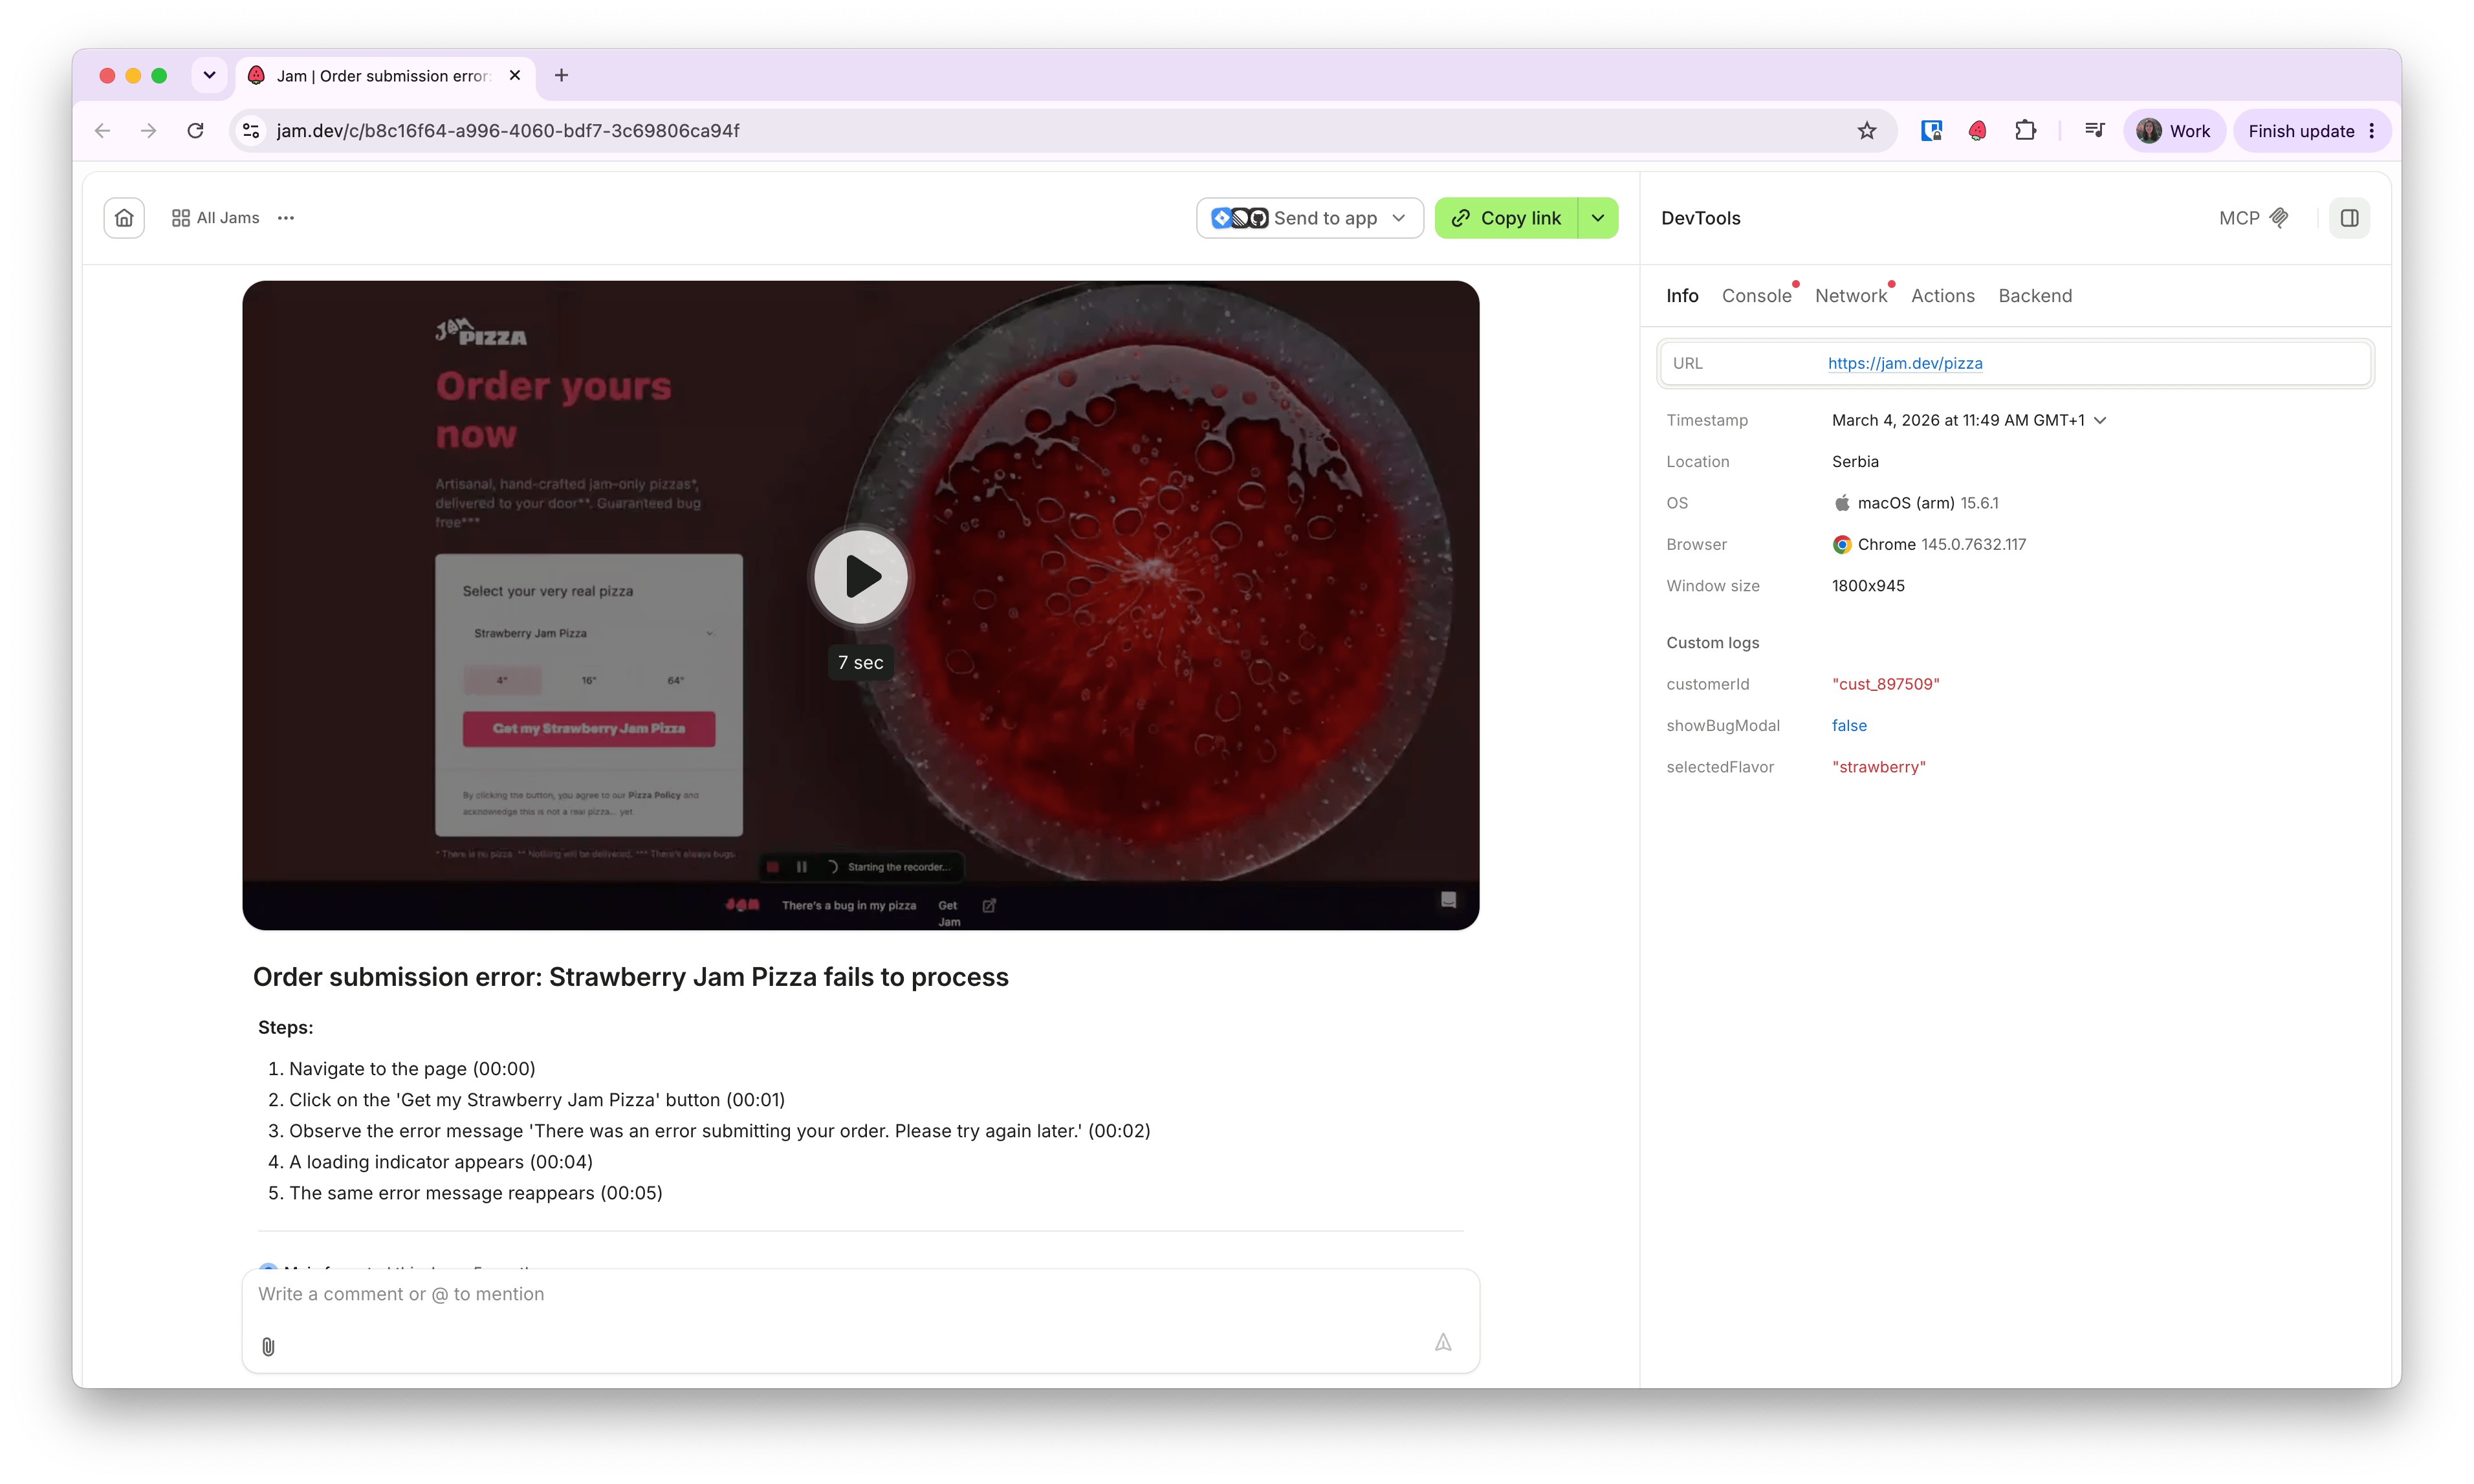
Embed Figma designs
You can paste Figma links into Jam, and engineers will see the Figma frame side by side with your initial bug report.1
Capture a visual bug
Use Jam to capture the bug on your screen.
2
Paste a Figma link in the description
In the Jam description, paste a Figma link.
3
Create the Jam
Click Create.
4
Open the embedded Figma
Open the new Jam. You’ll see a Figma icon at the bottom. Click it to reveal the Figma embed.